Projects
In my time at UCSB I’ve developed skills in ArcGIS, R, Excel, and STATA. I have experience with data cleaning, collection, analysis, and visualization methods. Here is a collection of links to some of the projects I’ve created:
Building a project website
- Built this static users site with Github Pages
- Learned what a yml file is, and how to edit one
- Created the basic files required for a website, including an index page and this page, and how to add them to a navbar
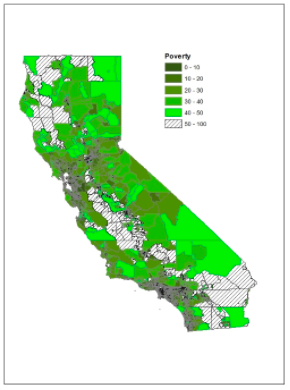
Agriculture and Food Access in California
- Honors contract for an upper division food systems class investigating trends in food insecurity and population dynamics among California’s top agricultural counties
- Collected and cleaned food access and food security data from government websites
- Used GIS techniques such as spatial overlays to illustrate trends in the data
- Reproducible code for analysis produced in RStudio and visualizations finalized using ArcGIS Online
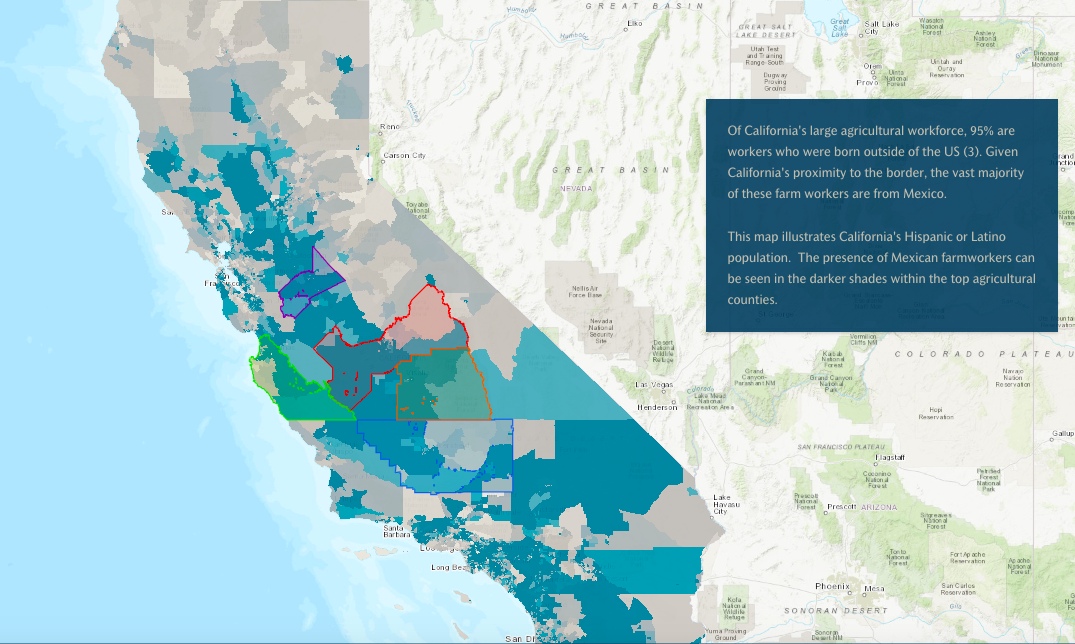
This is one of the maps I created for this project, highlighting the large Hispanic and Latino populations in the top agricultural counties in California. In this project I used visualizations like this map to help illustrate how the prevalence of food insecurity in these counties is linked to racial and political factors.
Statistical Analysis of Biological Data
- Statistical analysis report created using real-world biological data
- Statistical techniques used include analysis of normalcy variance, covariance, and use of transformations
- Practiced data visualization skills to aid in the interpretation of data and trends
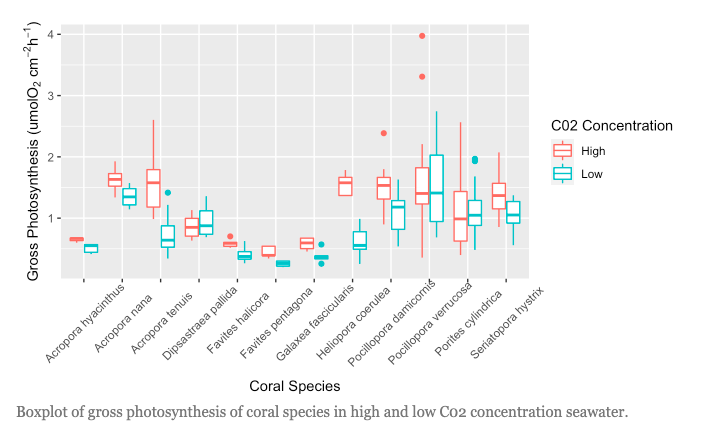
This image shows one of the visualizations I created for my report, illustrating the varying levels of gross photosynthesis of coral species at sites where seawater had high (red) and low (blue) concentrations of CO2.
Data Wrangling: Manipulating Live Covid-19 Pandemic Data
- Worked with live data from the COVID-19 pandemic sourced from the NYT
- Learned how to make tables and graphs with ggplot and knitr
- Worked on data.frame manipulation and joining datasets
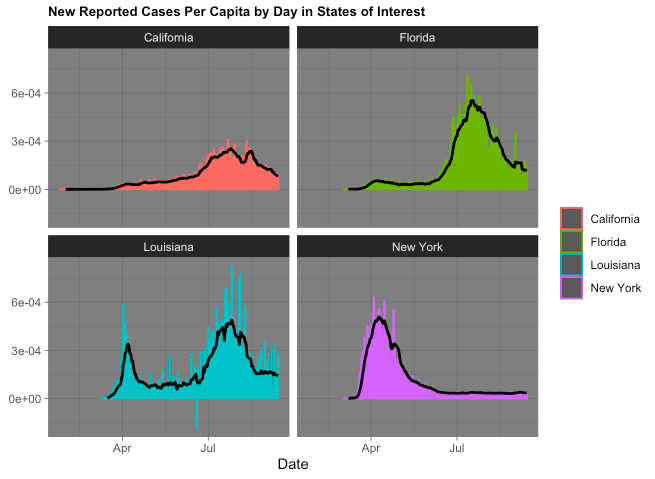
This image was produced using NYT COVID-19 data and shows daily new cases in four states, as well as the seven day rolling mean.
Projections, Distances, and Mapping
- Began working with simple features objects and geos measures
- Emphasis was placed on feature aggregations (combines/unions); coordinate references systems; and distance measurements
- Learned how to map geometric features, highlight features of
interest using
gghhighlightand label points neatly withggrepel
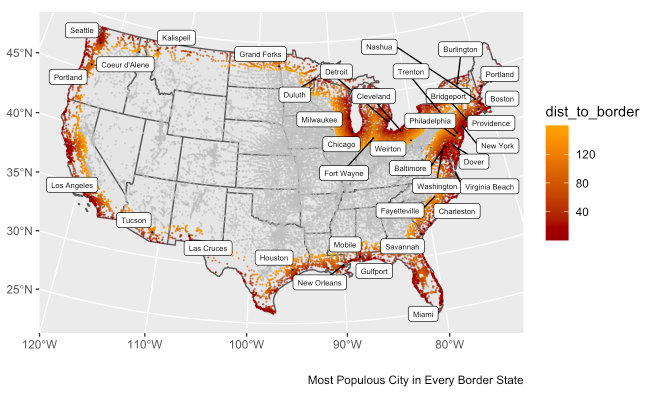
This map is a culmination of data analysis throughout the lab, and
the application of mapping tools such as gghhighlight and
ggrepel.
Tesselations, Spatial Joins, and Point-in-Polygon: Working with the National Dams Inventory
- Learned about geometry simplication, centroid generation, and tesselations
- Used tesselations to explore the distribution of dams (and dam purpose) across the USA and challenges with the MAUP
- Functions were implemented to automate repetitive tasks
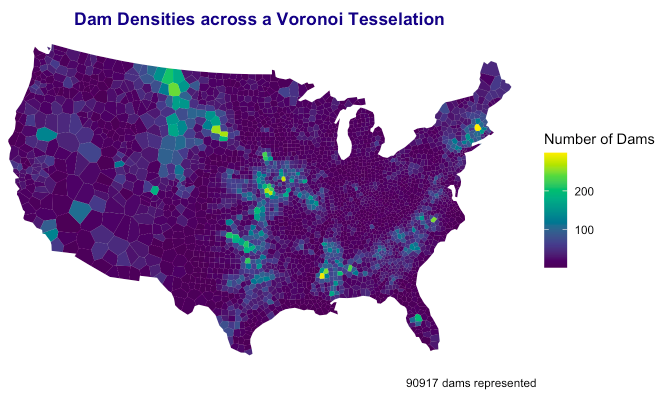
This image shows density of dam locations in a CONUS projection using a voronoi tesselation.
Raster Analysis and Remote Sensing
- In this assignment we worked with multiband raster files to detect and analyze a flood event near Palo, Iowa.
- Practiced accessing and analysing data from Landsat 8 satellite.
- Learned about how different wavelengths can highlight different features via different combinations in the RGB channels.
- Practiced raster analysis using raster algebra and thresholding.
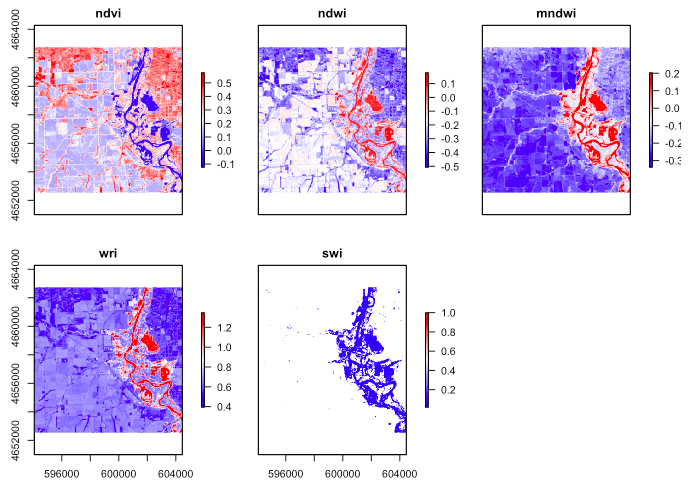
This image shows five unique thresholding methods for delineating surface water features, created using different combinations of Landsat bands.
Terrain Analysis: Flood Risk in Mission Creek
- Estimated the number of buildings impacted in the 2017 Santa Barbara flood event along Mission Creek using data from web APIs (NLDI, OSM, AWS Elevation tiles).
- Practiced accessing OSM data using the correct keys and values.
- Used the
whiteboxfrontend to generate a Height Above Nearest Drainage layer for the Mission Creek watershed. - This flood data was cross analyzed with the OSM data to identify and map impacted buildings.
This gif shows a flood inundation map library for Mission Creek for stage values ranging from 0 to 20 feet, with the hillshade, flood level, and impacted buildings for each stage.
Identifying Populations Vulnerable to High Heat in California
- Collected and cleaned data from government websites
- Used GIS techniques such as spatial overlays to analyze data
- Illustrated a correlation between data sets
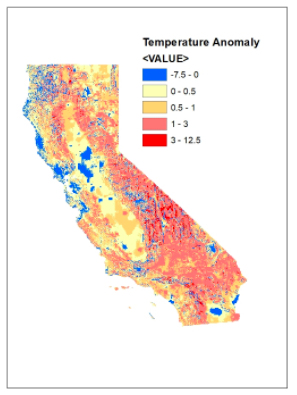
These images show visualizations of some of the data we collected for this project.